WORLD NEWS
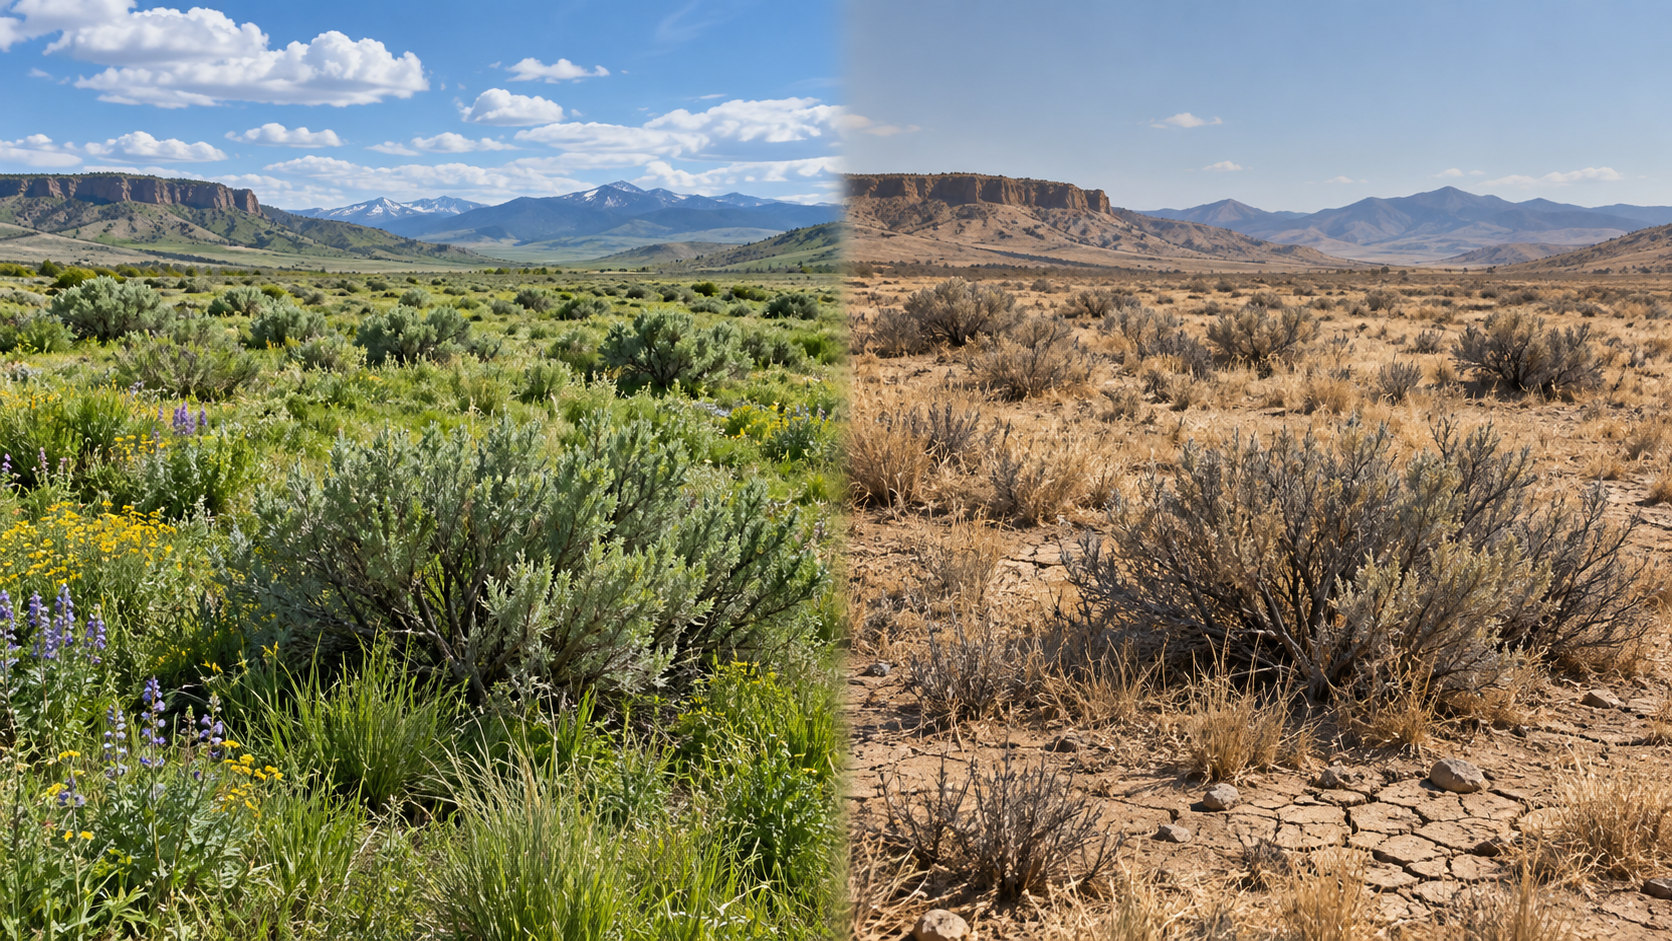
About 82% of greening drylands also became more variable year to year
Researchers analysed both the long trend and annual variability of leaf area index. Wet-year highs rose while dry-year lows declined across broad areas.
Drylands cover about 40% of land and support more than two billion people, making bad-year losses especially relevant to rain-fed farming and grazing.
Why averages hide the problem
A greener decade is not necessarily a steadier decade. Extra growth in wet, high-CO2 years may create more tissue to maintain when the next drought arrives.
What 13 models missed
None of 13 leading global vegetation models captured the observed rise in annual variability. Long-range productivity projections therefore omit an important source of uncertainty.
What 82% measures
It is the share of analysed dryland area with rising variability, not people or farms. Satellite leaf area is not complete ecosystem health and can combine shrub gains with grass losses.
What still needs checking
The pattern may signal declining resilience but does not predict collapse dates. Field vegetation, soil moisture, grazing and irrigation data must connect the satellite signal to food and forage losses.
Primary source and independent checks
Primary source: Nature Climate Change paper
Institutional explanation: University of Arizona research release
Independent check: Independent bibliographic check
Read in other languages
한국어 · English · Español · 日本語 · Tiếng Việt