WORLD NEWS
Zavodovski’s chinstrap penguin nests fell 63% between 2011 and 2025
A new study reports 63% fewer occupied chinstrap penguin nests on Zavodovski Island in 2025 than in 2011.
It compares breeding nests of one species on one island; it does not mean that 63% of all penguins worldwide died this year.
Combining colony area with nesting density
The British Antarctic Survey introduced the study on 7 October. It combines drone and aerial imagery with satellite records. The official dataset describes a drone survey on 14 December 2023 and colony boundaries from satellite images for 2011, 2016, 2020, 2022 and 2025. Nesting density measured in detailed imagery can be related to colony area to estimate trends. This differs from individually counting every bird by the same method in every year.
Two species followed different paths
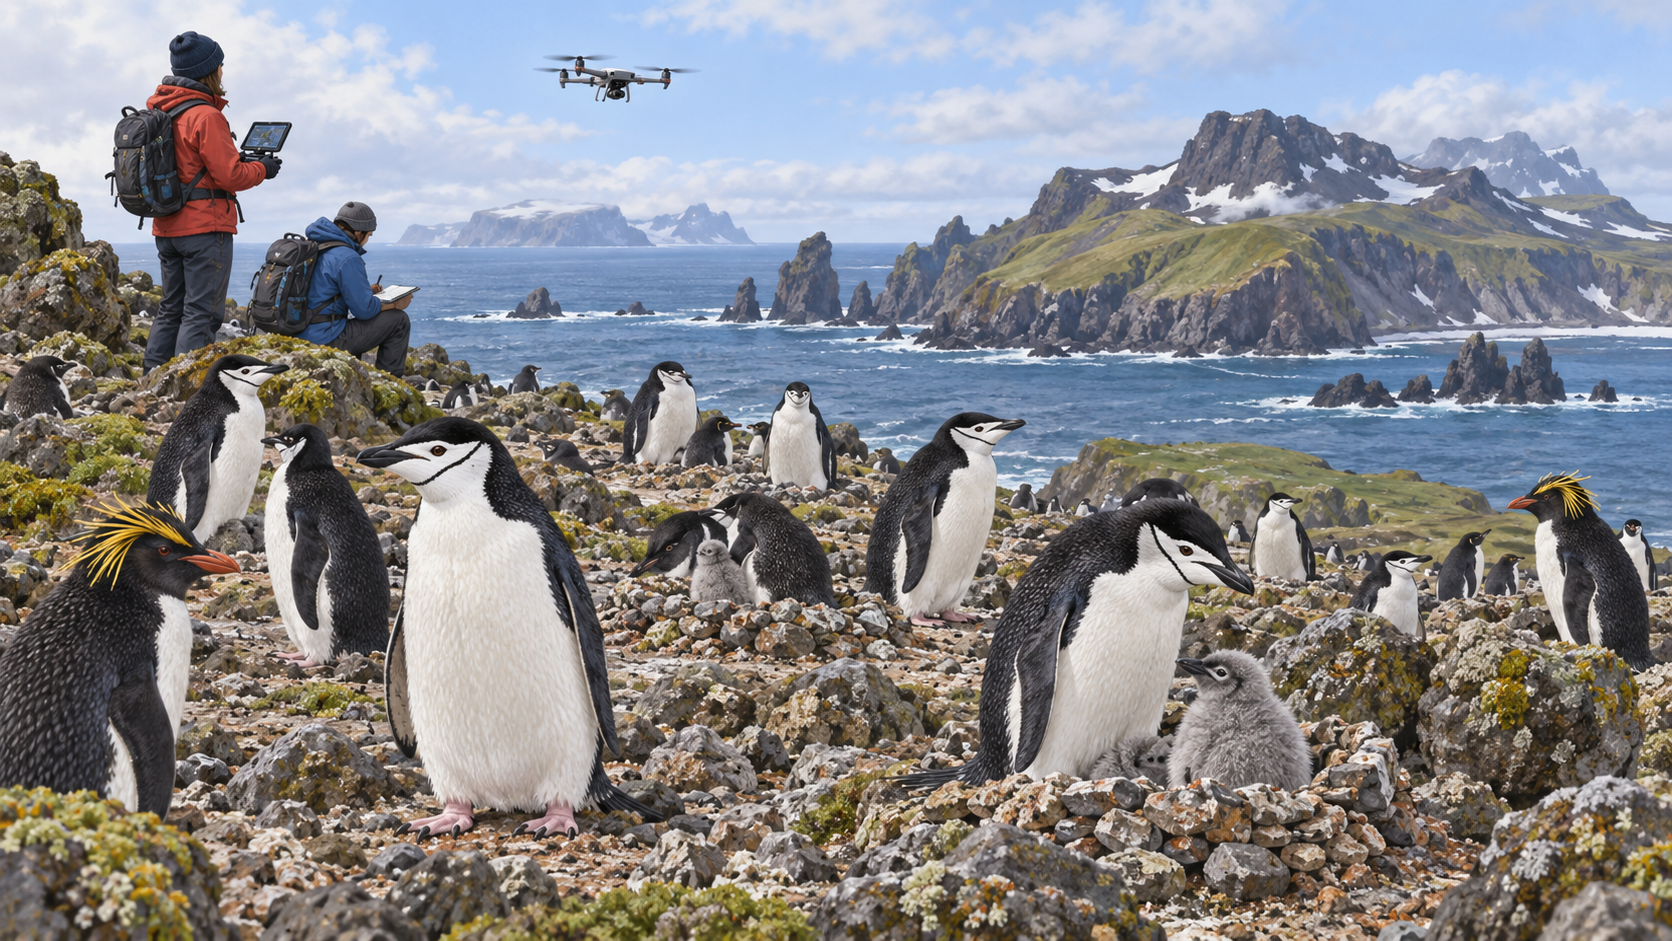
BAS reports that macaroni penguins increased 28% from 2011 to 2016 and then remained stable, while occupied chinstrap nests declined sharply. The 63% cannot therefore be applied to all penguins on the island. The researchers also say that, comparing total colony size, Zavodovski ceded its largest-colony position to Cape Adare in the Ross Sea. Changing species composition matters alongside the decline itself.
Food supply offers a stronger explanation than one eruption
The decline began before the island’s 2016 eruption, making that event alone an inadequate explanation. Tracking suggests that chinstraps depend more on cold waters and krill, while macaroni penguins can switch to other prey. Warming seas and altered food availability are the researchers’ leading interpretation. This is an explanation assembled from observations, not an experiment establishing the precise contribution of every cause.
What later surveys need to establish
Krill harvesting is banned inside the marine protected area, but BAS says effects on food supply from fishing in other areas connected by currents remain unclear. Subsequent nest surveys, prey information and movement tracking should be read together when assessing recovery. This article checks official dataset documentation, the institutional announcement and independent reporting. Direct access to the full paper was restricted, so it does not claim to have independently verified every analysis or uncertainty estimate. The illustration is not an actual colony photograph or measured map.
Primary source and independent checks
Institutional source: 63% fewer occupied nests and species differences: British Antarctic Survey
Official dataset: survey dates, satellite years, area and density estimates: UK Polar Data Centre
Original paper: direct full-text access restricted; public abstract and institutional explanation checked: Current Biology
Independent check: occupied-nest measure and interpretation of causes: Qore
Read in other languages
한국어 · English · Español · 日本語 · Tiếng Việt