WORLD NEWS
Antarctic winter sea ice peaks at 17.59 million km², the third-lowest satellite maximum
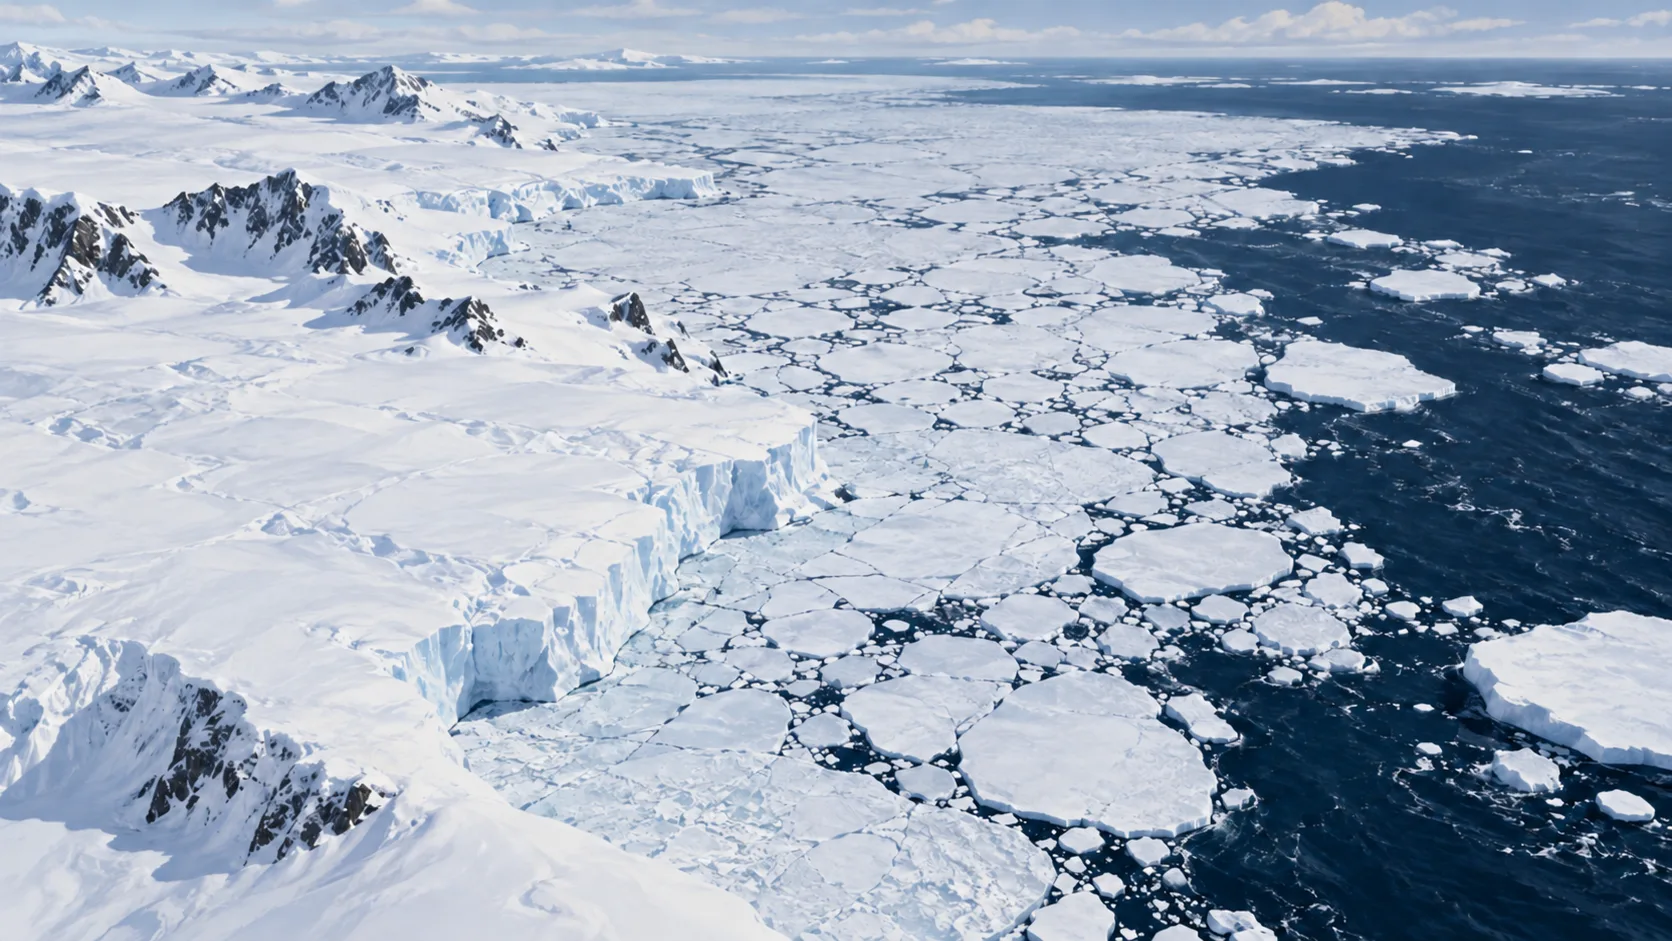
A map presented by NASA on 12 October puts Antarctica’s 2026 winter sea ice maximum at about 17.59 million km², the third lowest in the satellite record.
This is ocean ice extent on 14 September, not the volume of Antarctic land glaciers or ice melted on 12 October.
Separate the map’s publication from its observation
NASA and NSIDC estimate that the annual peak occurred on 14 September. NSIDC provisionally described it on 23 September; NASA presented the map and historical context on 12 October. Publication is not a new measurement date. An earlier ONEPRESS Arctic-minimum article briefly mentioned the Antarctic value; this article explains the Antarctic winter maximum’s measurement and comparison.
Extent is not a sum of ice alone
The metric counts satellite grid areas with at least 15% ice concentration. It includes open water inside qualifying areas, rather than summing only individual ice pieces. It does not reveal thickness or volume. NASA describes passive microwave sensors distinguishing emissions from ice and open water. Their ability to see through clouds supports repeated observations in poor weather.
A southern maximum differs from a northern minimum
Antarctica is land surrounded by ocean, allowing winter sea ice to expand outward. It normally peaks in September and reaches its minimum in February. The Arctic is near its summer minimum in September, so the seasonal meanings differ. Third lowest compares Antarctic winter maxima across years; it does not rank all Antarctic ice or identify an all-time minimum.
A ranking cannot establish a single cause
Antarctic sea ice varies substantially between years, with low levels persisting recently. The independent commentary checks the same NSIDC data rather than supplying new satellite measurements or experimental replication. Winds and ocean conditions must also be examined to assess causes. NSIDC updates and NASA’s long-term maps are the next checks. NSIDC cautions that fluctuations around the seasonal peak can delay confident identification of the maximum.
Primary source and independent checks
Primary source: date, results and method: NASA Earth Observatory
Primary source: date, results and method: NSIDC
Independent check: announcement, measurements and scope: Global Climate Risks
Read in other languages
한국어 · English · Español · 日本語 · Tiếng Việt